Historical cap rates represent important pieces of commercial property data needed for investment property valuation. Investing in any specific property requires collection of most reliable property market data and very thorough understanding of prevailing property market environment and recent investment property valuation trends.
Historical cap rates can help investors establish realistic ranges within which cap rates for a particular property type can move. Such ranges are useful when performing sensitivity analysis for a project in trying to establish a range of plausible rates of return that can be achieved by the project or property investment. In estimating such returns, the analyst needs to calculate the expected resale price at the end of the holding period.
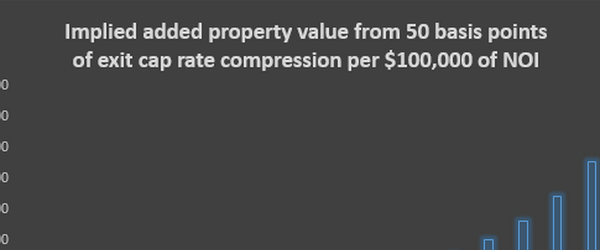
The most commonly used technique for estimating a resale price for an income-producing property is through the direct income capitalization approach, which divides the property’s net operating income (NOI) with an expected exit cap rate. Historical cap rate data can help the analyst to establish a realistic range for such exit cap rates.
Issues with Cap Rate Data
When reviewing historical cap rate data the analyst needs to know how the provided figures have been calculated. As it may be known the traditional formula for the capitalization rate is:
Capitalization Rate = Net Operating Income (NOI)/Market Price (Value)
Usually this data can be obtained by specialized vendors that provide cap rates by market and property type. As such, they represent averages of cap rates involving properties within each type and market. In general, the historical cap rate data provided by vendors may fall under one of the following four categories in terms of the inputs that are used to calculate them:
1. Both the numerator and denominator of the formula are based on sales transaction data in the period for which the data refers to. Thus, the NOI figure in the numerator is the actual NOI of properties transacted and the market price in the denominator is the respective actual sales price of the properties transacted.
2. The sales price in the denominators the actual sales price of a property, but the NOI in the numerator is not the actual NOI of the property transacted but an estimate of the NOI that the property would command given market rents and the characteristics and location of the property.
3. The NOI in the numerator is the actual NOI of the property but the market price in the denominator is the appraised value of the property, as the property has not been transacted during the period for which the cap rate is estimated. Actually the cap rate data reported by the National Council of Real Estate Investment Fiduciaries (NCREIF) fall in this category.
4. Both the NOI in the numerator and the price/value in the denominator represent estimates of NOI that a particular property would command and its market price during the period for which the cap rate is reported


Comments